On this page
Three key points
In the 2025 benchmark, roughly one fifth of world oil passed through.
Bypasses exist; capacity and achieved flow are different.
The Uzbek transmission chain is conditional; no price increase is quantified.
What period does the film cover?
The film explains March–September 2026. EIA’s 6 October outlook also described constrained oil flows from the Middle East; its model inputs were finalized on 1 October. This is an explainer, not a live news feed.
September figures do not establish today’s flows or tomorrow’s prices. A bypass diagram does not guarantee uninterrupted operation.
How much oil and gas passed through?
In the first half of 2025, oil flows averaged 20.9 million barrels/day: roughly one fifth of global oil consumption and one quarter of maritime oil trade. Asia received 89% of crude and condensate; China, India, Japan and South Korea together received 74%. More than 20% of LNG trade also passed through.
These are pre-crisis 2025 benchmarks. The 89% applies to crude and condensate, not all cargo. The eight coastal states are not the same list as the seven producers in the oil table.
39 km and two lanes
The narrowest width is about 21 nautical miles, or 39 km. Each traffic lane is two nautical miles, about 3.7 km, rounded to approximately 4 km in the narration. Iran is to the north and Oman’s Musandam peninsula to the south.
The lanes and port routes are explanatory schematics, not navigation charts or political boundaries.
A tanker and the TV tower: visible scale
A VLCC carries approximately 1.9–2.2 million barrels. 20.9 million divided by roughly 2 million is approximately ten VLCC cargoes/day. Bahri lists Abqaiq at 333 m, rounded to approximately 330 m in the film. Tashkent TV Tower is 375 m. The tanker’s length is rotated vertically to compare it with the tower’s height.
This is a cargo-volume equivalent, not an observed ship count. Not every tanker is 333 m long. The port, tanker and tower are not claimed to appear together in an actual photograph.
The March disruption and prices
IEA’s 12 March report described the largest oil supply disruption in history. EIA’s Brent spot series gives $71.32 on 27 February, $102.38 on 12 March and $138.21 on 7 April. The film separates these dates.
These are daily spot prices, not futures, another oil benchmark or today’s pump price. $138 is an April observation. The film makes no claim about attackers, responsibility or casualties.
Bypasses: capacity, route and actual flow
Saudi Arabia’s East–West pipeline is approximately 1,200 km to Yanbu. The UAE operator lists Habshan–Fujairah at approximately 406 km; its 2012 design capacity was 1.5 million barrels/day. EIA’s September outlook describes August Yanbu exports at approximately half July’s level and increased Suez shipments. The Iraqi ministry’s 30 September figures reported by Rudaw imply 250,000/2.65 million ≈ 9.4%.
Pipeline capacity is not achieved daily flow. The Iraqi share is a calculation from a dated September report. Later reports can cover different periods or flows. The film shows no Hormuz-bypass oil pipeline for Kuwait, Qatar or Bahrain; it does not deny future proposals.
Shut-ins, inventories and seafarers
EIA’s September table, February output / average March–June shut-in (thousand barrels/day): Kuwait 2560/1648; Iraq 4400/2880; Qatar 557/463; Bahrain 193/143; UAE 3600/925; Saudi Arabia 10500/2923; Iran 3390/455. Total 25200/9435. UAE July–August shut-ins were estimated at zero. EIA’s September year-to-date inventory decline estimate was 400 million barrels; dividing by two million gives approximately 200 VLCC cargoes. IMO reported approximately 20,000 stranded seafarers on 24 April.
These are EIA’s September estimates, not current inventory measurements. IEA’s September observed-stock estimate of 507 million since February is a different series and is not substituted for EIA’s figure. 200 tankers is a volume comparison. The seafarer figure is dated April.
Uzbekistan: a possible transmission chain
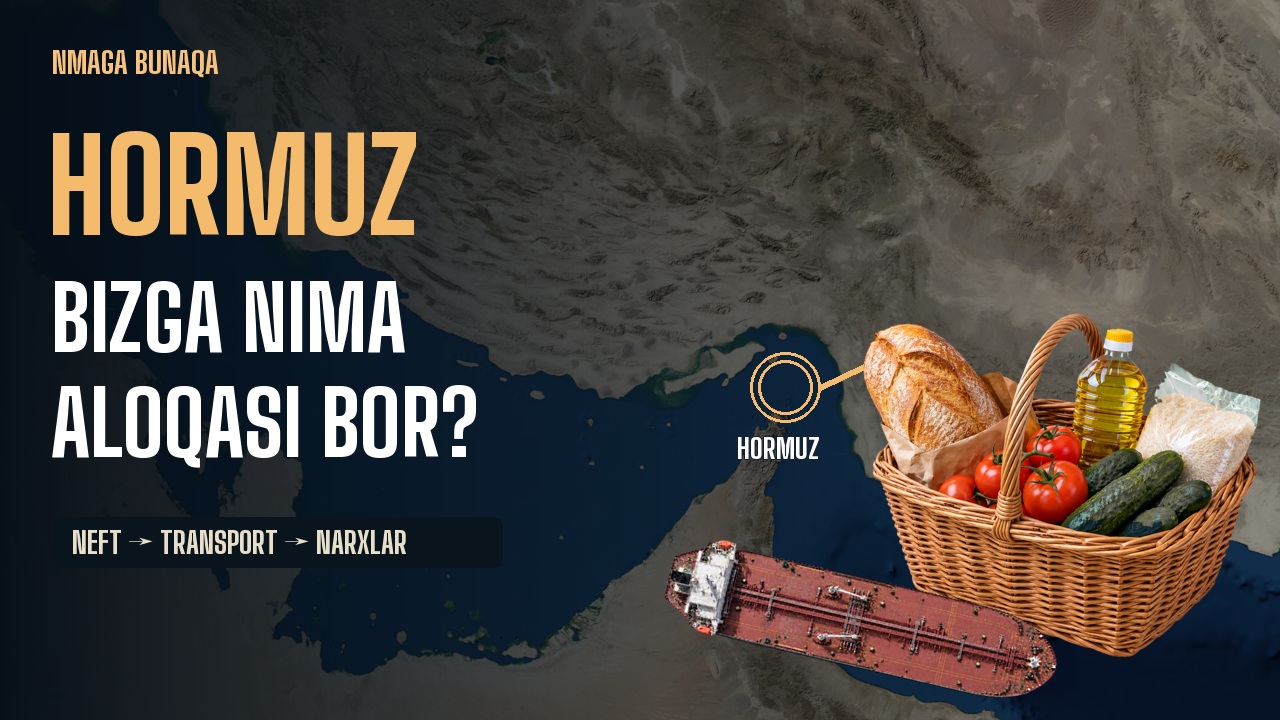
FAO warned on 26 March of combined fuel and fertilizer cost pressure: up to 30% of internationally traded fertilizer normally passes through the Hormuz corridor. The 4 April report of the Uzbek central-bank chair’s comments concerns possible pressure on imported food and energy costs. The 2023 transport agreements mention terminals and warehouses in Bandar Abbas and Chabahar.
The basket explains a conditional mechanism. We did not measure or forecast how much Hormuz raised prices in Uzbekistan. 30% is not Uzbekistan’s fertilizer-import share. The 2023 agreement does not establish current cargo volumes.
The 1980s: this exposure is not new
Shipping in the Gulf was at risk in the 1980s. The film connects that historical observation with the present economic mechanism.
The sepia map is not an archival photograph. No attack or casualty counts, military tactics or attribution of responsibility are asserted.
Satellite imagery and visual rights
Hormuz comparisons: 21 February, 28 March and 29 September 2026. Port imagery: Ras Tanura 3 October; Fujairah 4 October; Yanbu 7 September; Ceyhan 11 September. Direct catalogue links to the Sentinel-2 scenes follow. NASA Blue Marble is the base map. Matthew Smith made the Ras Laffan photograph.
A single satellite pass does not measure daily or total traffic. Routes are simplified and ships enlarged. Tanker, tower, basket and object cutouts are illustrative reconstructions, some made with AI; they are not photographs of an actual event.
About the materials
Contains modified Copernicus Sentinel data (2026). NASA Blue Marble Next Generation — public domain. Ras Laffan: Matthew Smith, Flickr, CC BY 2.0; cropped/reframed. Terrain: Terrain Tiles, provenance linked above. Big Shoulders Display, Barlow Condensed and IBM Plex Mono — SIL OFL. Tanker, tower, basket, objects and cover are illustrative reconstructions, some made with AI. Liam voice — ElevenLabs.
“Ibn Al-Noor” and “Desert City” by Kevin MacLeod (incompetech.com). Licensed under Creative Commons: By Attribution 4.0. https://creativecommons.org/licenses/by/4.0/
Music
Found an error?
If you find a specific error or a better source, send us the claim and its link. We will review it and date any correction on this page.
Write to us on Instagram