On this page
Three key points
Boneless beef rose 25% in 2025; this is not all meat or a current retail price.
45 kg is available supply per person, not measured eating.
Cattle, feed, time and transport are explanatory factors; their individual price contributions are not calculated.
25%: which meat and which period?
The National Statistics Committee’s December 2025 CPI release reports a 25.0% annual increase for boneless beef. The film’s price board specifies this product and year.
It is not the increase for every meat, a current price at a particular market or a 2026 change.
45 kg is availability, not measured eating
The OWID-processed FAO food balance series gives 2022 meat supply of 45.16 kg per person for Uzbekistan and 44.44 kg worldwide, rounded to 45 and 44. World Bank population is 21.49m in 1992 and 34.94m in 2022. Supply × population ÷ 1000 gives about 0.528m and 1.578m tonnes, nearly threefold.
Availability at the end of the supply chain is not what each person ate. The calculation uses 24.56 kg in 1992 and 45.16 kg in 2022. Historical FAO methods and population estimates are revised. This approximate comparison is not a demand forecast or a decomposition of the 25% rise.
More cattle is not the same as ready beef
FAO via OWID records about 5.11m cattle in 1992. SIAT records 14.3945m on 1 January 2025. Samarkand and Kashkadarya lead with 1.7659m and 1.7625m. The regional map is dated and measured in thousand head.
Cattle counts include dairy animals and young stock, not just beef ready for sale. The two years use different official series; the map is not a 2026 census.
What do 25 kg and 3 kg compare?
Table 1 of Alexander et al. (2016) estimates global average dry feed inputs of 25 kg per kg edible beef and 3.3 kg for poultry. Narration rounds poultry to about three. Raising a calf takes time.
These are not local farm feeding rules. Dry matter includes all feed, including forage, not only grain. The images are schematic; no universal growth time or individual-cow ratio is claimed.
Less area does not mean the same loss of output
Naumov and Pugach’s IAMO DP188 (2019) reports fodder-crop area falling from 1005 to 268 thousand hectares in 1992–2017, down 73%. Cattle grew about ×2.3; yield rose from 45 to 174 centners per hectare, about ×3.9. The study also discusses feed shortages.
This does not mean 73% less feed production or measure current land area. The sun and dry field illustrate a conditional drought mechanism, not documentary evidence of a 2025 drought.
Dated ministry figures for feed costs and imports
On 8 May 2025 the Agriculture Ministry compared feed prices with October 2024: oilseed meal 3000 → 7000 soum (×2.33), alfalfa 25000 → 45000 (+80%). It also reported total meat imports of 93 thousand tonnes in 2024 and described cost pressures.
These are ministry-quoted prices, not a national feed-price index. Seven months means October to May. Imports cover all meat in 2024. Trucks and the cost journey are illustrative.
The World Bank’s $7.51 is not a local retail price
The World Bank Pink Sheet monthly beef indicator reached $7.5073812/kg in November 2025, rounded to $7.51. This is the maximum in the retained 1960–2025 monthly series; the chart uses 792 monthly observations.
It is an international benchmark, not every country’s retail price. Dollars are nominal, not inflation-adjusted. The record is within the checked 1960–2025 series, not a claim about today in 2026. The final receipt illustrates factors, not a calculation adding to 25%.
Images, map and cover
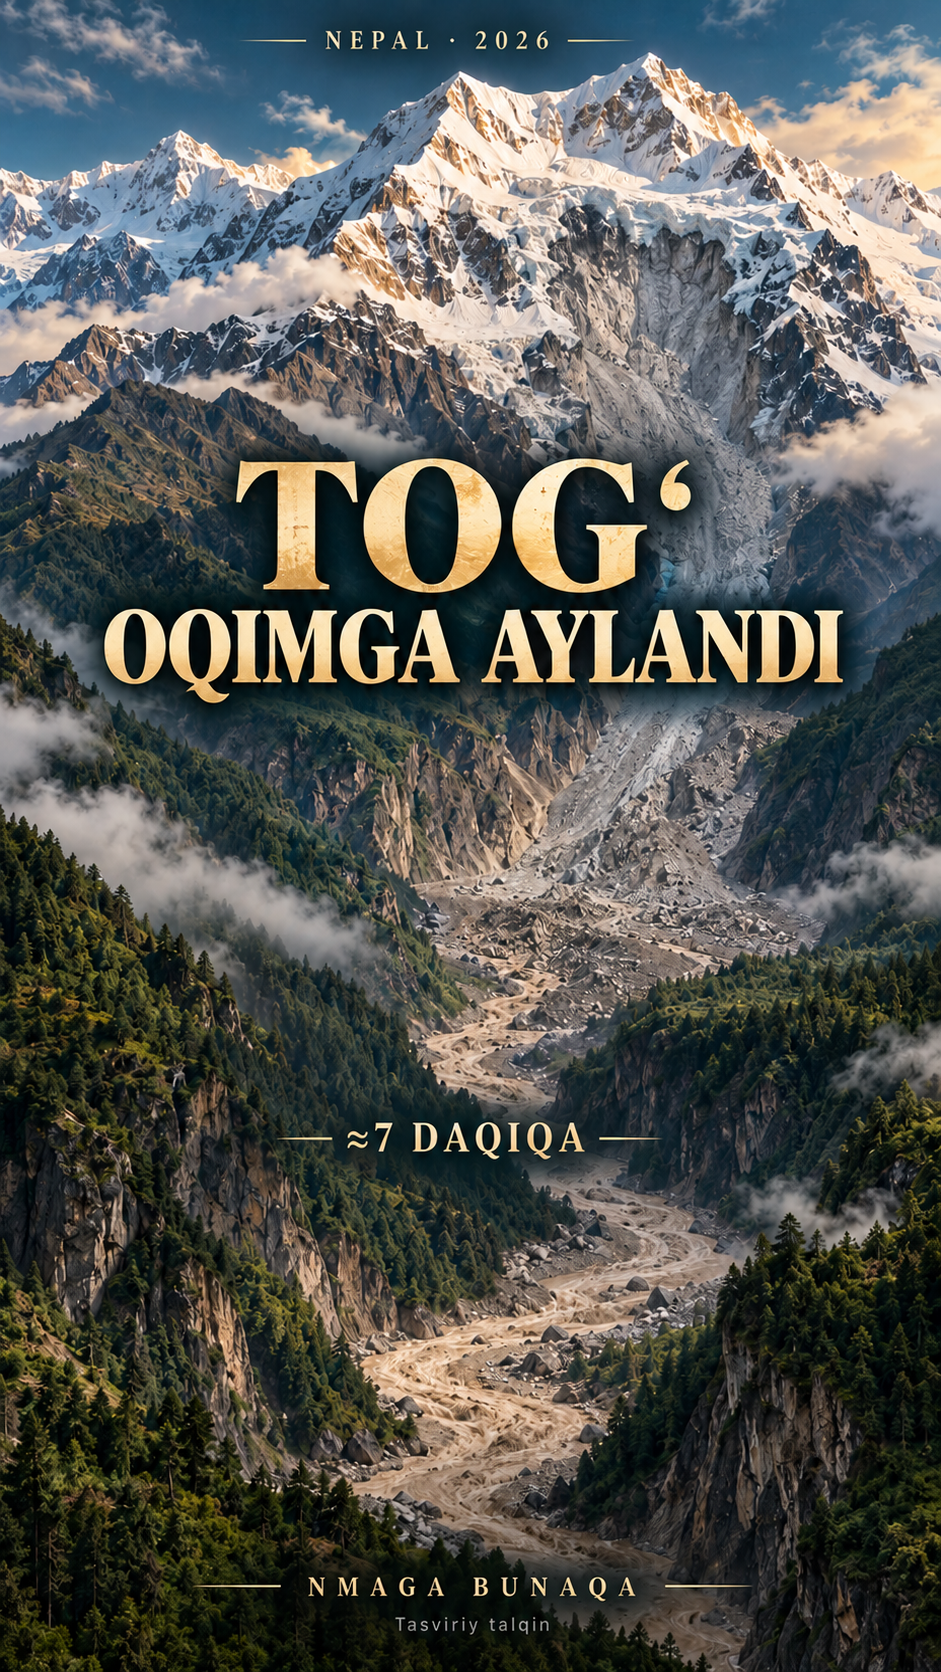
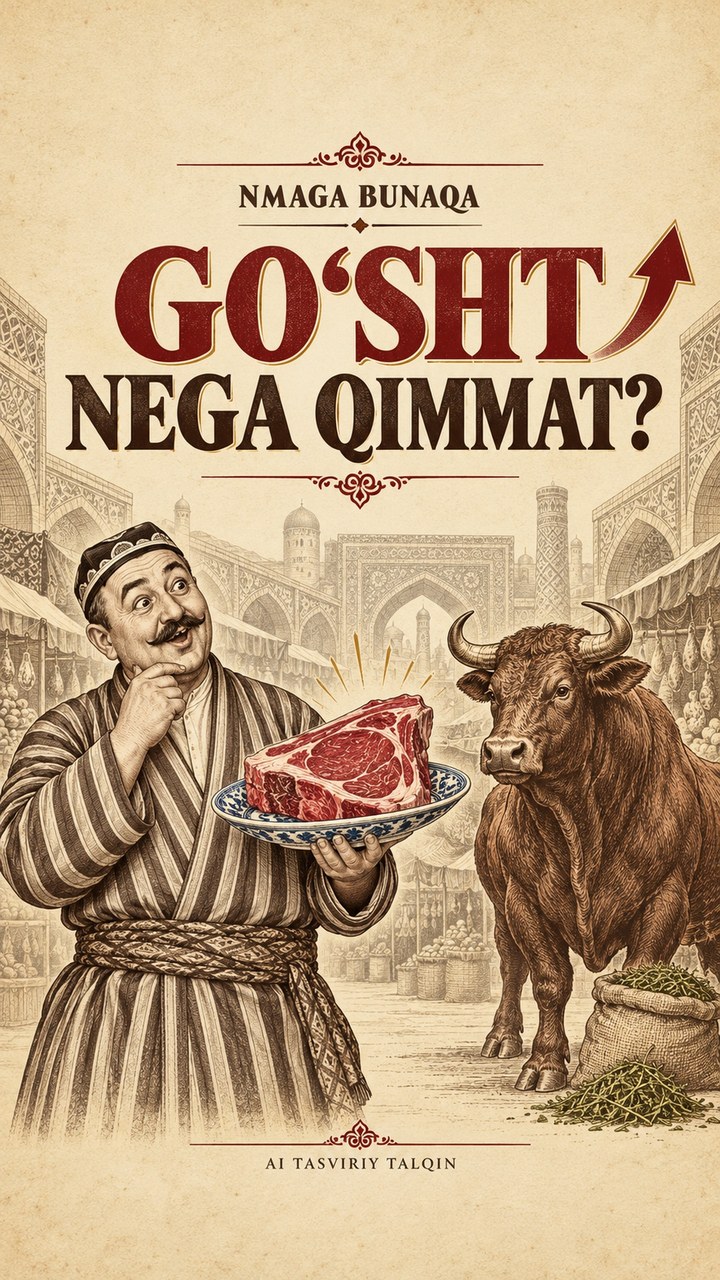
The bazaar, person, meat, animals and objects are AI-generated engraving illustrations. The cover is marked as an AI artistic interpretation. Regions use simplified geoBoundaries gbOpen UZB ADM1 from OpenStreetMap / Wambacher, ODbL 1.0. Fonts are Cinzel, Cormorant Garamond and Permanent Marker.
These are not documentary images of a particular market or farmer. Diagrams are redrawn for explanation. Research PDFs are linked, not republished in full or used as copied figures. The cover’s background does not establish an exact historical location.
Music and verification scope
Investigations by Kevin MacLeod (incompetech.com), CC BY 4.0. Excerpted, filtered and mixed under narration. Four gentle effects are studio synthesis. This page matches the 1 minute 41 second cut.
Sources and retained tables were checked on 10 October 2026, including the retained official statistics PDF. Figures refer to their stated dates. Please report errors with the specific claim and source.
About the materials
Illustrations and cover: AI artistic interpretation, Nmaga Bunaqa. Map: geoBoundaries gbOpen UZB ADM1, OpenStreetMap / Wambacher, ODbL 1.0; simplified. Data: National Statistics Committee, FAO via OWID, World Bank, Agriculture Ministry and the cited studies. Cinzel and Cormorant Garamond: SIL OFL; Permanent Marker: Apache 2.0. Investigations by Kevin MacLeod (incompetech.com), CC BY 4.0; excerpted, filtered and mixed.
Music
Found an error?
If you find a specific error or a better source, send us the claim and its link. We will review it and date any correction on this page.
Write to us on Instagram