On this page
Three key points
125 cm and 2.5 million m³ are the institute’s 2025 estimate.
≈40% refers to a preliminary 100 m² trial, not the entire glacier.
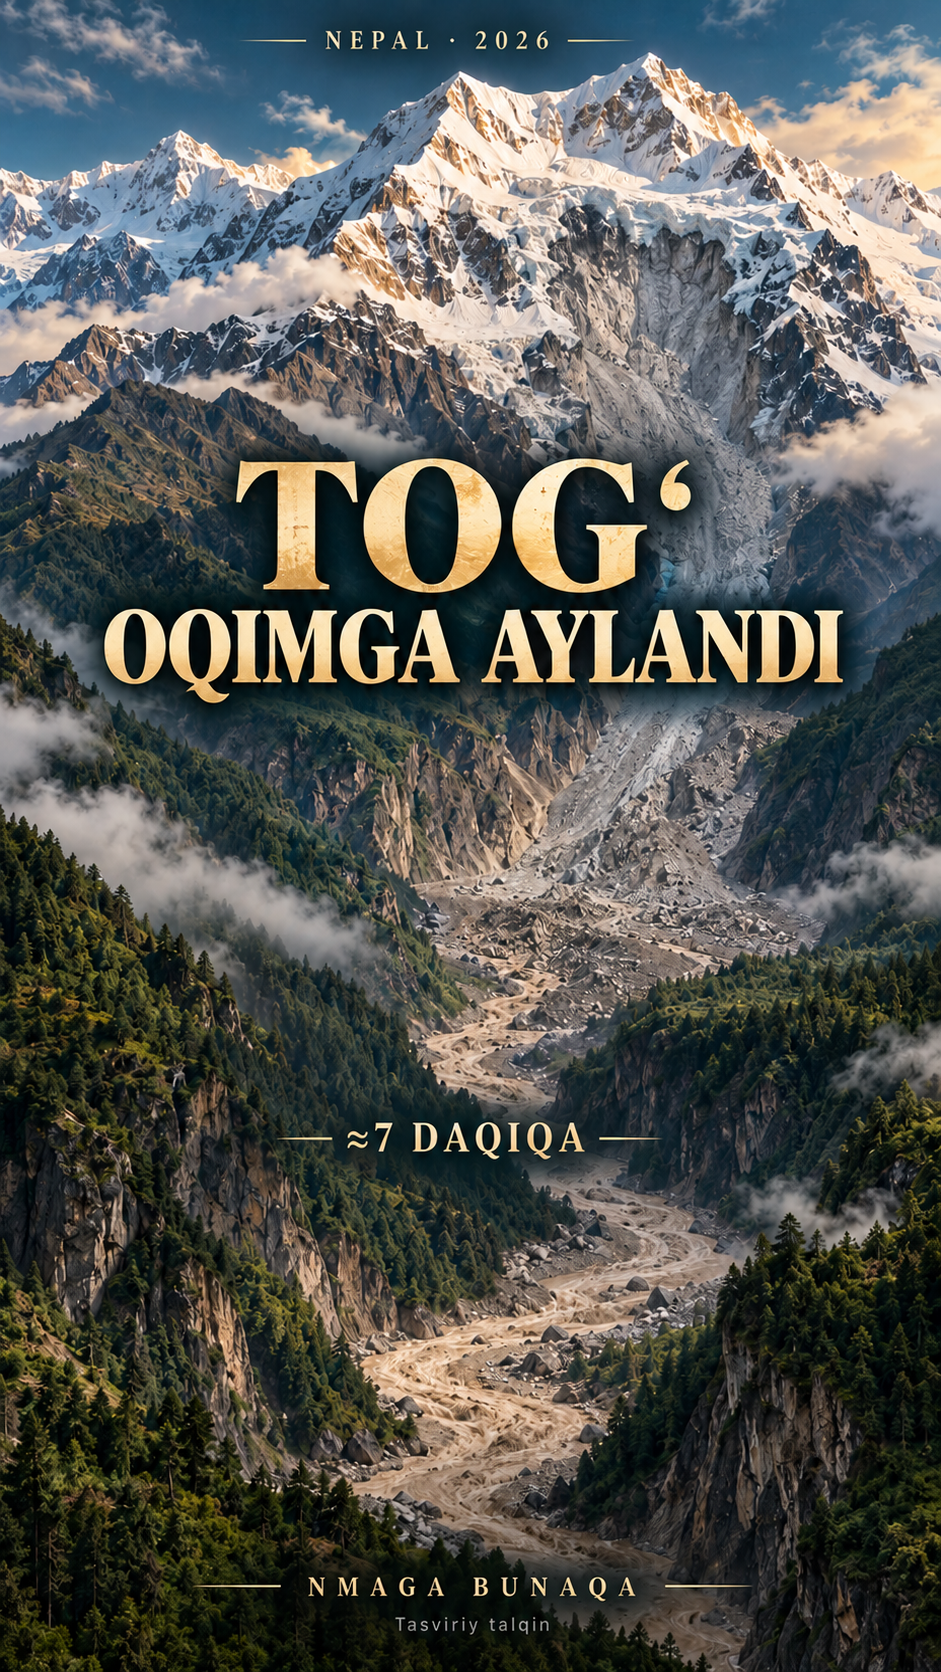
The route, glass and ice column are explanatory diagrams or visual metaphors.
More melting is not always good news
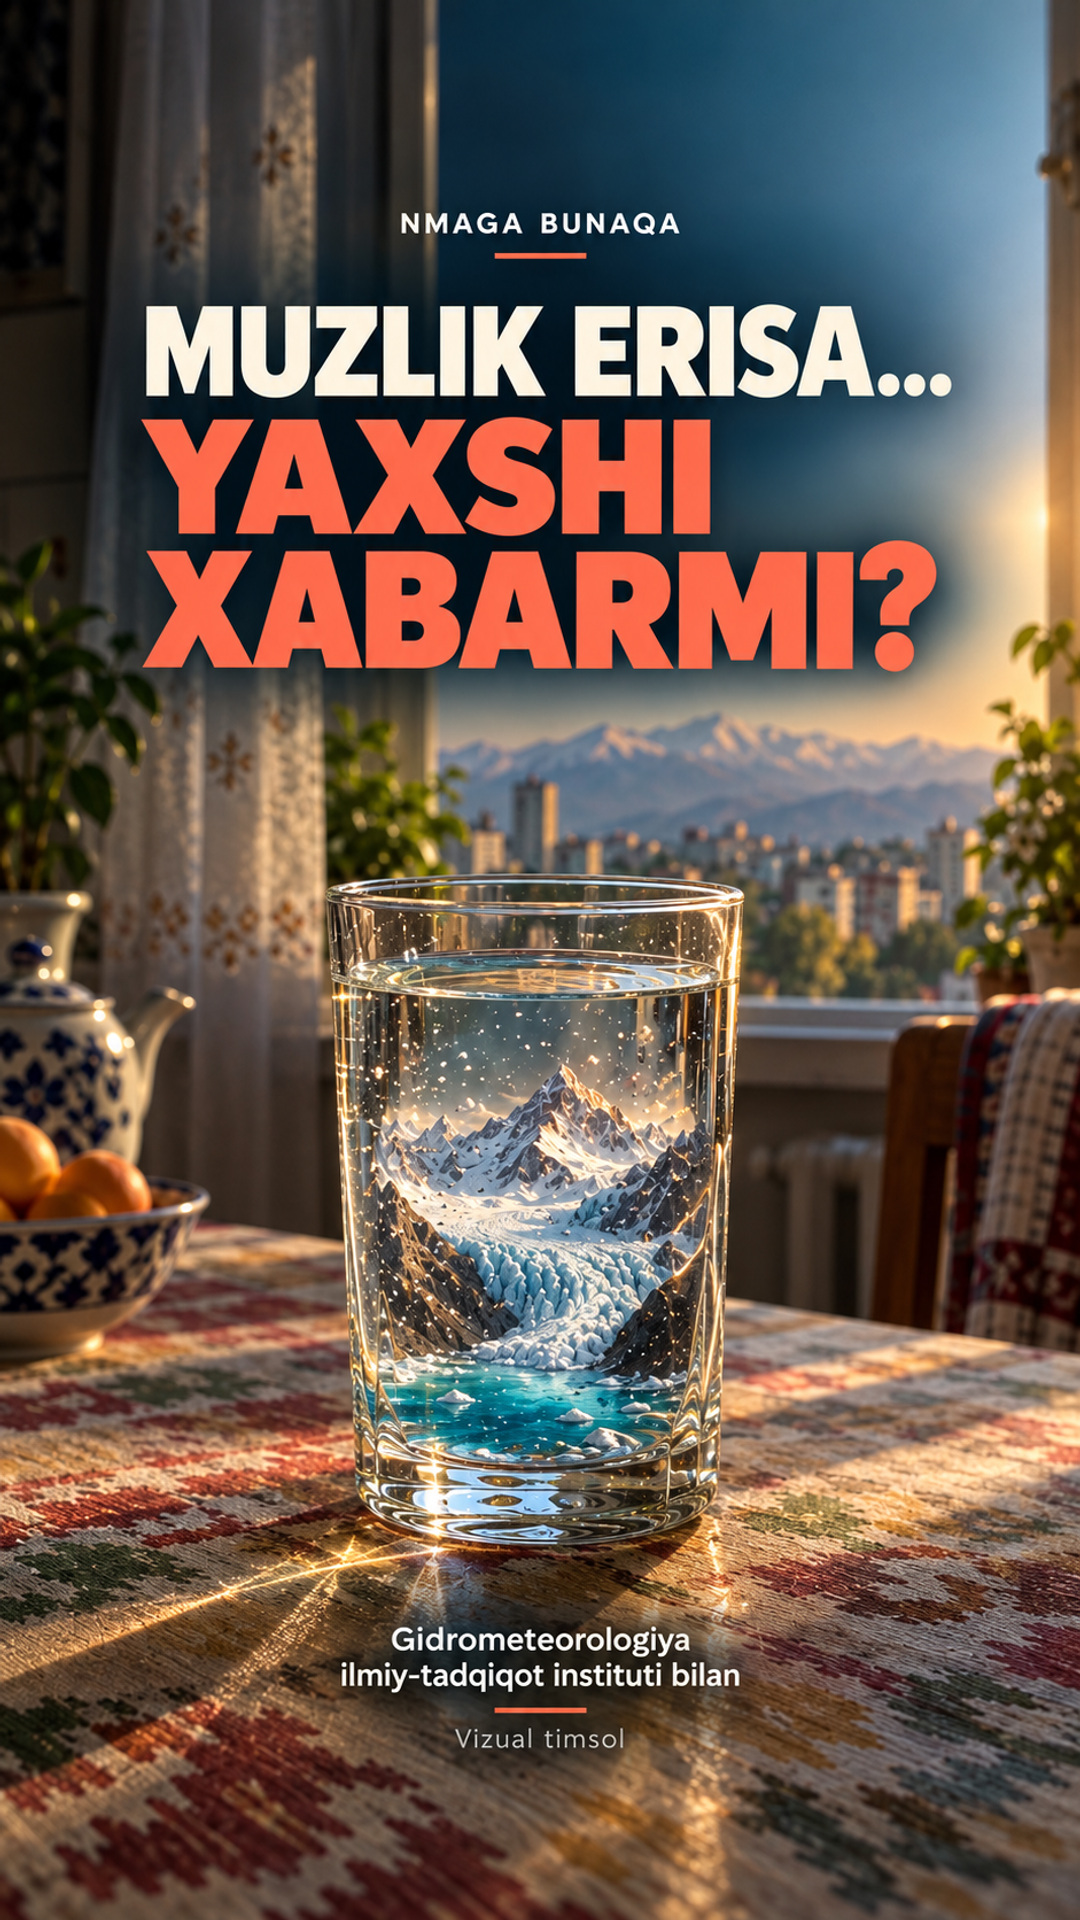
Glacier melting can initially supply more runoff. As ice storage shrinks, the glacier contribution may eventually decline. The film explains this general mechanism.
This is not a dated or quantified forecast of total Pskem or Charvak inflow. Rainfall, seasonal snow, groundwater and evaporation also matter. The miniature glacier in a glass is an AI visual metaphor, not evidence that the glass water came from Barkrak.
Stakes and snow reserves are measured together
The film uses the Hydrometeorological Research Institute’s supplied “Glaciology” text, maps and expedition footage as primary material. The exposed part of a fixed stake illustrates local ablation. Measurements across locations and snow reserves are considered together.
One stake is not a whole-glacier result. The animation is schematic, with no invented stake reading or monthly series. The 2022 drilling footage is not labelled Barkrak because its location was not identified in the supplied source. The supplied document is not offered as a public download.
125 cm, 2 km² and 2.5 million m³
The institute’s supplied “Glaciology” material reports 125 cm of ice-thickness loss across a 2 km² Barkrak area for 2025. Calculation: 1.25 m × 2,000,000 m² = 2,500,000 m³ of ice. On a selected 105 × 68 m footprint, 2,500,000 ÷ 7,140 ≈ 350.14 m. The TV tower is 375 m high.
The annual result is attributed to the institute; we did not conduct an independent field survey. Ice volume is not water volume without a density conversion. The footprint is an explicit comparison. The ice column is an illustration, not an actual event in Tashkent.
A preliminary 100 m² cover trial
The institute’s report dated 28 September 2026 compares a 100 m² geotextile-covered plot on Middle Barkrak with an uncovered control. Both have stakes. Following the 24 September expedition, the preliminary finding was approximately 40% less melt beneath the cover.
This is a small preliminary trial, not protection of the entire glacier. Diagram values 100 and ≈60 are relative quantities, not centimetres or a time series. The two original field photographs date to August 2026; they are not presented as photographs of the September measurement result.
Maps and seasonal satellite scenes
The Tashkent–Charvak–Barkrak route combines OpenStreetMap rivers, terrain and schematic connections. Seasonal scenes use Sentinel-2 L2A, October 2024–September 2025: eleven scenes, with cloudy February omitted. Acquisition dates appear on screen.
The route is not an expedition GPS track, road or drinking-water pipe. Images illustrate snow cover, not measured ice thickness, snow percentages or simultaneous stake readings. Crossfades are not continuous daily observations.
Images, music and fonts
Supplied expedition footage, stake/snow diagrams and original August field photographs are credited to the institute. The glass-glacier and cover are AI visual metaphors. Tower photograph: Alpasli, CC0; the ice column was added. Music: Unanswered Questions by Kevin MacLeod (incompetech.com), CC BY 4.0. Fonts: Archivo, Archivo Black, IBM Plex Mono, Cinzel and Cormorant — SIL OFL.
Photo dates and trial limits are retained. Illustrations do not replace measurements. The institute’s 2025 result relies on its supplied primary material; a public citation does not mean every private document has been publicly released.
About the materials
Supplied expedition footage, stake/snow diagrams and original August field photographs are credited to the institute. The glass-glacier and cover are AI visual metaphors. Tower photograph: Alpasli, CC0; the ice column was added. Music: Unanswered Questions by Kevin MacLeod (incompetech.com), CC BY 4.0. Fonts: Archivo, Archivo Black, IBM Plex Mono, Cinzel and Cormorant — SIL OFL.
Contains modified Copernicus Sentinel data 2024–2025. © OpenStreetMap contributors, ODbL. Terrain: AWS Terrain Tiles / Tilezen.
Music
Found an error?
If you find a specific error or a better source, send us the claim and its link. We will review it and date any correction on this page.
Write to us on Instagram