On this page
Three key points
Three degrees is an anomaly in the Niño 3.4 monitoring region.
El Niño influences rainfall probabilities; it does not alone attribute an individual rain.
The 100 km circle is a scale example. Winter–spring effects are not guaranteed.
Which three degrees?
NOAA CPC’s weekly table gives a Niño 3.4 anomaly of +3.2 °C on 30 September 2026. The film rounds this to three degrees. The 10 September discussion confirms strengthening El Niño.
This is not the whole ocean’s temperature. Weekly Niño 3.4, seasonal ONI and the daily coloured map are different products. Checked 7 October; the next NOAA discussion is scheduled for 8 October.
Fourteen Uzbekistans, fourteen thousand kilometres
Niño 3.4 spans 5°N–5°S, 170°W–120°W. A spherical calculation gives 6,174,329 km²; dividing by Uzbekistan’s 448,900 km² gives about 13.75, rounded to 14. The great-circle distance from Tashkent to its centre is 14,276 km.
The outlines compare the monitoring box, not all warmed water. They overlap for display. The route measures distance between places; it does not track moisture from the Pacific to Tashkent.
Fishermen, the “little boy” and the wind
NOAA links the name to Peruvian fishermen and warm water around Christmas. Trade winds normally push warm surface water west. When they weaken, warm water and rising air spread towards the central and eastern Pacific.
The section, fish reaction and wind lines are explanatory illustrations. Events vary; the mechanism alone does not attribute an individual rainfall event.
An influence, not a guarantee
Mariotti (2007) links El Niño precipitation in southwest Central Asia with enhanced southwesterly moisture transport, strongest in autumn and spring. Gerlitz and coauthors (2019) analyse cold-season weather and tropical and extratropical drivers.
Mediterranean and Indian Ocean moisture paths are schematic. Wetter conditions are not guaranteed in every winter or location. This is not a local 2026–27 weather forecast.
Cloud seeding and the calendar
WMO describes cloud seeding as treatment of existing clouds. A 100 km radius circle is an illustrative scale sample beside the roughly 5,560 km equatorial monitoring box. NOAA issued an El Niño Advisory on 11 June 2026.
100 km is not a universal technology limit. Scale alone cannot determine the cause of a particular rain. The advisory date does not mean temperatures changed abruptly that day. Uzhydromet described neutral conditions and warming on 26 May.
Calendar, record and mudflow warning
The calendar averages NOAA weekly Niño 3.4 values within each month. The record chart refers to that weekly 1981–2026 series. Uzhydromet warns that heavy foothill rain increases mudflow risk.
This is not a whole-ocean or thousand-year record. Monthly averages are not identical to the official monthly index. Future question marks mean unknown. Mudflow locations and paths are schematic, not a current alert or an inevitable El Niño disaster.
Maps, illustrations and music
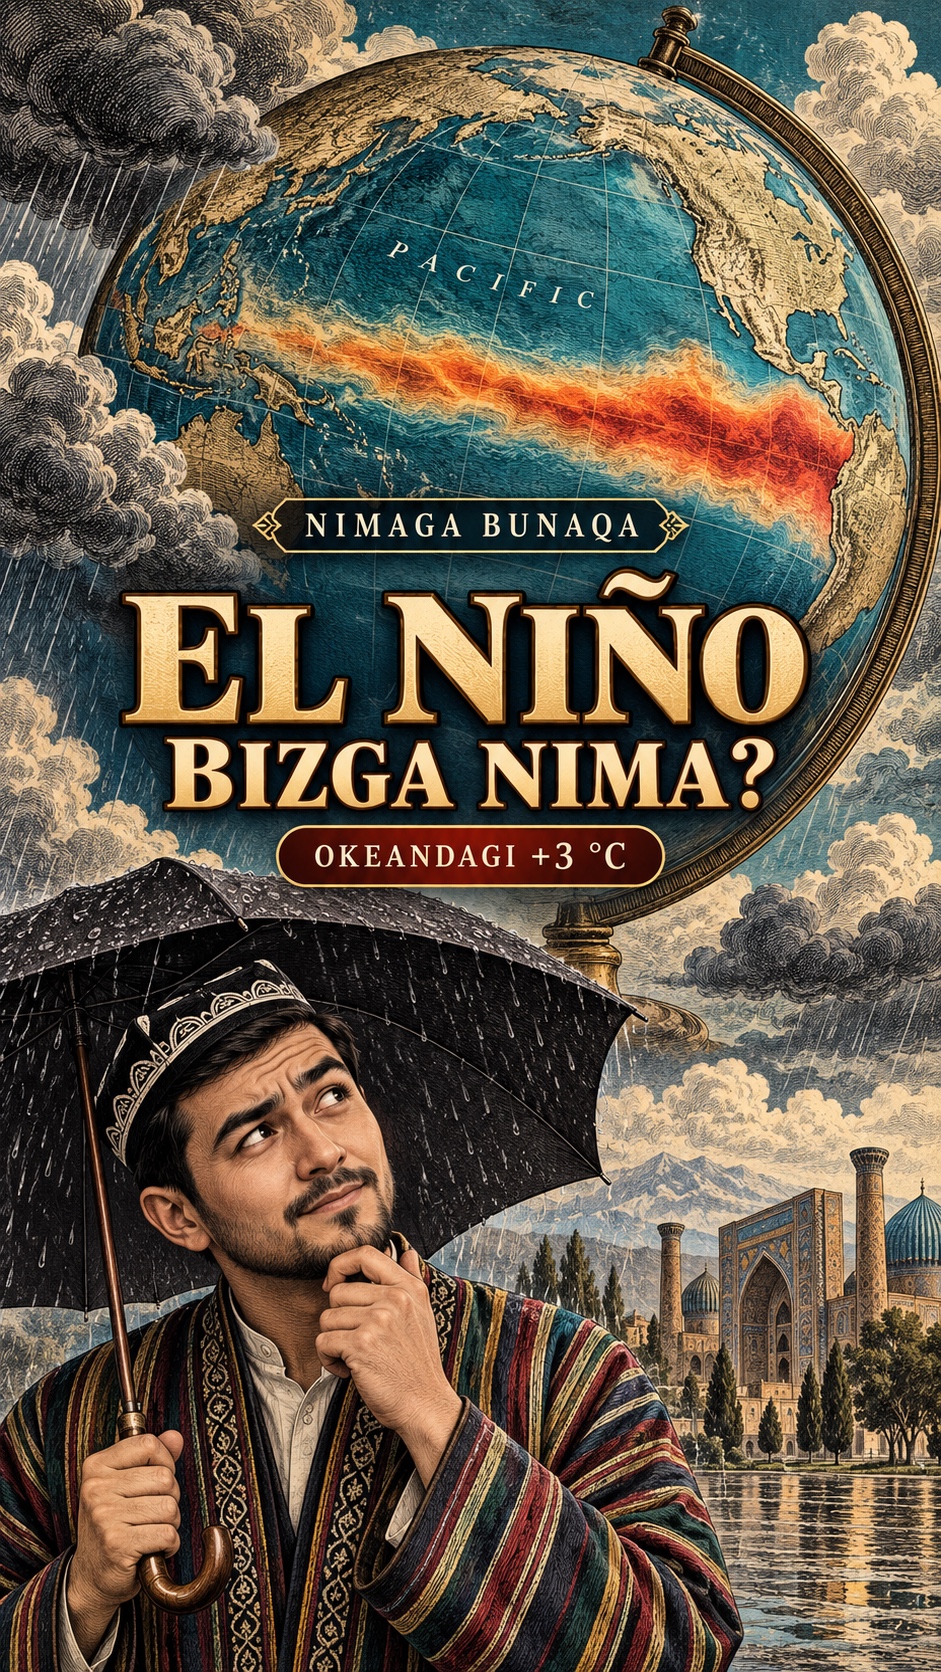
Ocean colours: NOAA OISST v2.1 daily anomalies, 15 January–30 September 2026, 0.25° grid, smoothed. Outlines use Natural Earth; globe context uses NASA Blue Marble and NOAA ETOPO. Engraved characters and the cover are original AI editorial illustrations.
OISST colours use the 1971–2000 baseline; the weekly thermometer uses 1991–2020. Animation interpolates between snapshots. AI illustrations are not observations or archive photos. Music: Investigations — Kevin MacLeod, CC BY 4.0, ducked and faded.
About the materials
Ocean colours: NOAA OISST v2.1 daily anomalies, 15 January–30 September 2026, 0.25° grid, smoothed. Outlines use Natural Earth; globe context uses NASA Blue Marble and NOAA ETOPO. Engraved characters and the cover are original AI editorial illustrations.
Investigations by Kevin MacLeod (incompetech.com). Licensed under Creative Commons: By Attribution 4.0. https://creativecommons.org/licenses/by/4.0/
Music
Found an error?
If you find a specific error or a better source, send us the claim and its link. We will review it and date any correction on this page.
Write to us on Instagram